The US high yield market has grown larger and riskier since the financial crisis. Issuers of debt have the whip hand as buyers compete to gain an allocation in the face of surging demand from CLOs and retail funds. Companies are emboldened to seek ever-weaker covenants and are taking advantage of the current conditions to borrow more at lower margins. It’s as if the financial crisis never happened.
High yield bonds carry a lower credit rating than investment grade, and in the case of Standard & Poor’s, a rating below ‘BBB-’. High yield was previously called ‘junk bonds’. Whilst the timing of a downturn in high yield debt isn’t predictable, the outcomes when it does happen are. More debt, riskier quality, and weaker covenants means the coming downturn will be bigger, longer, and uglier. A quick review of some key data makes this clear.
The data tells a story
The size of the US high yield bond market and leveraged loan market are both close to double what they were in 2007.
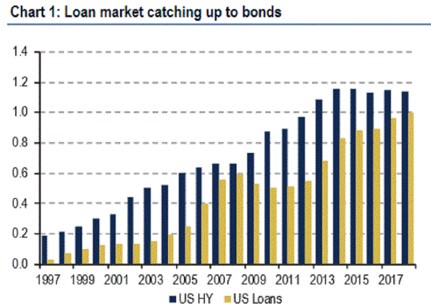
Source: BofA Merrill Lynch, Global Research LCD
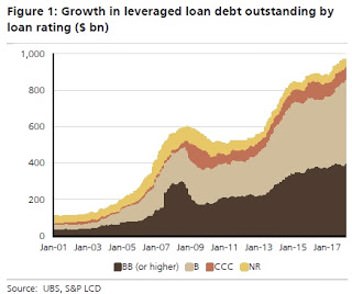
Not only is the outstanding debt larger, but the credit ratings have shifted downwards on leveraged loans. Lower credit ratings mean a higher default rate when liquidity dries up.
The other key indicator to watch is the share of the loan market that has weak covenants. In 2007, 17% of outstanding loans were covenant-lite. Today, over 80% of new issuance lacks decent covenant protections. Weak covenants delay the occurrence of an event of default, which allows zombie companies to continue operating until they either exhaust their cash reserves or cannot refinance maturing debt.
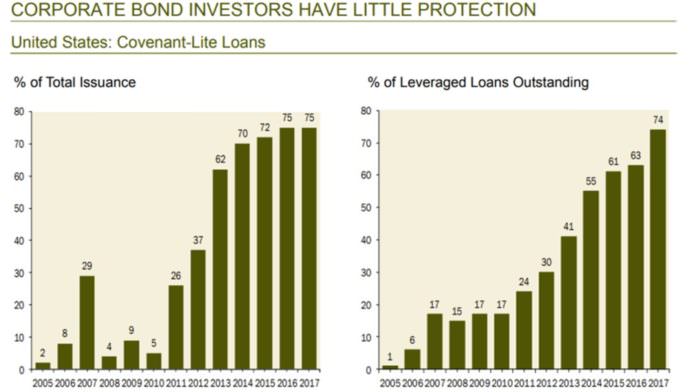
Source: BofA Merrill Lynch, S&P LCD, Guggenheim Investments. Published by: Gluskin Sheff & Associates Inc.
High yield bulls are likely to cite the substantial equity contributions from sponsors and healthy interest coverage ratios as reasons not to be overly concerned. These are definitely much better than 2007, but these indicators do have some inbuilt weaknesses. Equity contributions are only as good as the market valuations they are based on. As US equities are arguably overpriced, sponsors are having to pay more than they historically would have to purchase a company. If price/earnings ratios revert to lower levels, company valuations will fall wiping out some of the equity cushion and making the debt a higher proportion of the enterprise value.
Interest coverage ratios are also benefitting from two deviances from historical levels. Libor has been low but is now on an upward path. For companies that have hedged, either via interest rate swaps or by issuing fixed rate debt, their protection will last for a time. For those with floating rate debt and no interest rate swaps, their interest coverage ratios will generally have started to fall already due to higher Libor.
The average margin paid on top of Libor for leveraged loans is now at close to the lowest levels since 2007. When adjusted for the risk, spreads are at the lowest levels since 2007. When spreads revert, issuers with near term maturities will be the first to feel the impact with higher interest bills pushing their interest coverage ratios down.
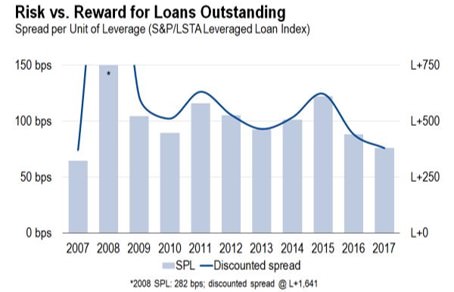
Source: LCD, an offering of S&P Global Market Intelligence
The shape of the next downturn
We can use the size of the high yield debt market and the probabilities implied by the current credit ratings to estimate how much debt might default. Using the historical average three-year default rates, we would expect over $250 billion of debt to default in the next three years. However, high-yield-debt default rates have long periods below the average and short bursts way above the average. Looking back to the downturns immediately following the tech wreck and the financial crisis, those three-year periods posted roughly double the average default levels. This points to the next downturn seeing over $500 billion of high yield debt defaulting. There will be plenty of opportunities for the $74 billion of dry powder held by distressed debt funds.
However, the substantial increase in covenant-lite loans will flatten and lengthen the default cycle. Zombie companies will struggle on as the lack of maintenance covenants stops lenders from forcing equity raisings, asset sales, or bankruptcies that would better protect their positions. Whilst this will delay inevitable restructurings, investors will see their returns impacted far earlier as markets will reprice the debt of zombie companies to distressed levels well before the losses crystallise after a default.
Some managers dispute the impact of covenant-lite levels on recoveries. They point to data to argue that their investors have little to worry about from the growth of covenant-lite. But few managers are willing to hand back capital or to substantially change strategy when conditions in their market segment are unfavourable.
Moody’s takes a different view and is forecasting an average recovery rate of 60% on first lien loans, well below the historical average of 85%. They cite more covenant-lite lending and lower levels of subordinated debt as increasing the risks for lenders. In 2007, covenant-lite loans were almost exclusively made to lower-risk borrowers. Today, both lower and higher risk borrowers benefit with less cushion provided by second lien loans and unsecured high yield bonds.
How can investors respond?
There are three main options: switch to cash, de-risk, or change sectors.
Switch to cash: As the spread in high yield debt is barely covering the average expected losses from defaults, this isn’t as extreme as it might seem. The increasing return on cash-like investments in the US has recently risen above the dividend yield on the S&P 500. Add in the expectation of additional increases in the Federal Funds Rate and going to cash is a legitimate alternative whilst waiting for a correction in high yield debt. The lost carry of 3-4% per annum is the main downside and investors need to be prepared to pay this price for an unknown period, potentially several years.
De-risk: Switching from B and CCC rated debt to BB rated debt, selling covenant-lite loans/bonds and targeting shorter duration debt are ways to reduce the risk but still stay invested in high yield debt. Like switching to cash, this will reduce the carry on the portfolio but the give-up is only 1-2% per annum if an investor is starting with an average portfolio. Execution of the switch may be tricky though, as there will be a very limited universe left after applying two or more of these de-risking filters. What remains will mostly be older vintage debt, which is often very tightly held.
Change sectors: Another common strategy is to give up some liquidity by shifting from public loans and bonds to private debt. The higher historical returns and stronger covenant packages would make this a very obvious shift if not for the huge amounts of capital that have flowed into private debt in recent years, competing away some of the returns. This may turn out to be a case of past returns not being a reliable indicator of future results.
The Australian option
In Australia, we have been implementing a switch to property debt for our clients. The pullback of the major Australian banks from investor lending, interest-only loans and foreign buyers has opened up a substantial gap for others. Senior loans secured by completed residential property, borrowers with substantial excess income, low duration (2-5 years) and low LVR/LTV ratios (60-70%) are delivering net returns of around 6.5%. The illiquidity of these loans is substantially lessened by their low duration, which will see principal returned over the medium term when other credit investments are hopefully offering a better risk/return proposition. There is capacity for at least one institutional investor to put significant capital to work in this strategy.
Jonathan Rochford, CFA, is Portfolio Manager for Narrow Road Capital. This article is for educational purposes only and does not address the circumstances of any investor.