Which countries won the medals in the race to beat their pre-GFC stock market highs?
Global stock markets peaked in late 2007 at the top of the global credit boom, before plunging 50% or more in the 2008-2009 GFC. Since then some countries have done better than others. At one extreme, the Venezuelan market has kept on rising without missing a beat throughout the GFC and the 2011 sovereign debt crisis, despite suffering severe domestic political and economic crises. Other markets have just kept going down (with the occasional minor recovery), like Greece, Cyprus, Slovakia, Slovenia, Jordan, Morocco, and Italy. Most markets are still somewhere between their late 2007 highs and their early 2009 lows.
The medal table
The following chart shows the current index levels for 60 major stock markets (as at Monday 24 February 2014) relative to their pre-GFC all-time highs.
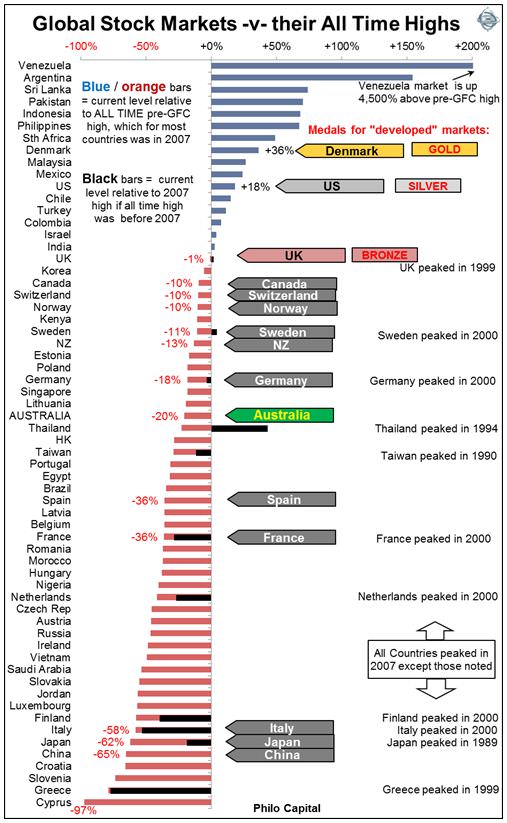
The blue/orange bars indicate the current level of each stock market index relative to its all-time pre-GFC high, which for most countries was in late 2007. The black bars indicate the current level relative to the 2007 high if the all-time high was before 2007. For example the Thai market (FTSE SET index) is currently 43% above its 2007 peak but still 23% below its 1994 all-time peak (before the 1997 Asian crisis hit).
Many European markets had their all-time peaks in the 1999-2000 dot-com bubble, and today are still below both their 2007 peaks and their dot-com peaks. On the other hand Japan peaked at the end of 1989 and it may never see those levels again.
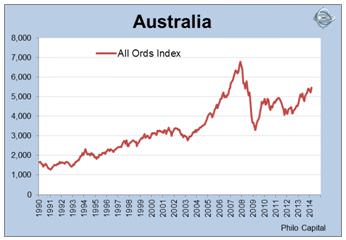
Australia is currently in 11th place among the developed markets (even NZ is beating us!). Since Australia is considered a ‘developed’ market with a mature economy, we are primarily interested in how we have gone against other developed markets.
(This study excludes the impact of dividends, inflation and exchange rates, and instead uses broad price index returns in local currencies in each country. In this way it reflects how local investors saw their local share price index move over time in nominal terms, which is the way most people think about stock markets in their own country).
Here are the medalists. We will cover each of the medal winners in more detail in later articles in this series.
Gold medal: Denmark
In January 2013 Denmark became the first of the ‘developed’ country stock markets to reclaim and beat its pre-GFC high. It had peaked on 11 October 2007 at the top of the global credit bubble right before the GFC hit.
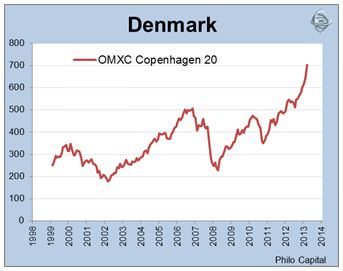
The Danish stock market had a similar experience to most other markets over the course of the past decade. After surging in the late 1990s dot-com boom it collapsed in the 2001-2002 tech wreck, rose strongly from early 2003 to October 2007, plunged 50+% in the GFC, rebounded strongly in 2009, but fell back in the 2011 sovereign debt crisis, and then surged during the 2012-2013 rally.
On paper, Denmark should not be a good place to do business, as it has:
- an old and rapidly aging population
- very high dependency ratio
- the world’s highest minimum and average wage levels
- the highest pensions in the world (as a percentage of pre-retired incomes)
- the highest tax rates (top marginal tax rates above 60%, plus 25% VAT)
- high social security costs (social expenditure takes up a mammoth 30% of GDP)
- a huge government sector (the government employs more than one third of all workers)
- heavy unionisation
- mountains of stifling European regulations
- a fixed currency
- lack of natural resources
- a location stuck on the edge of a decaying Europe in structural decline.
However it still manages to be a world class high-tech manufacturer and exporter with the best performing stock market in the developed world.
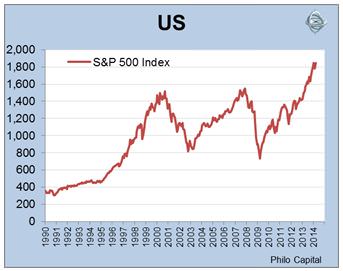
Silver medal: USA
The US was the second developed world stock market to reach new highs after the GFC. The S&P 500 index peaked at 1,527 on 24 March 2000 at the height of the dot-com frenzy, and then just beat that level with a new high of 1,565 on 9 October 2007. It then promptly plunged in the GFC to a trough that was lower even than the bottom of the 2001-2002 ‘tech-wreck’. In March 2013 the S&P500 index finally recovered and exceeded its dot-com and 2007 highs.
Like Denmark, the US suffered a sharp and deep domestic contraction (the longest and deepest since the 1930s depression). The economy has only been saved from deflation and further contraction by the Federal Reserve’s zero interest rate policy and its unprecedented asset buying programs. Unemployment levels reached 10% in the sub-prime crisis and are still too high five years later. Economic growth is still relatively weak and bond yields have been rising since July 2012, but the stock market is soaring.
Bronze medal: UK
Like the US, the UK market also had an astronomical dot-com boom in 1999-2000. The all-time peak for the FTSE-100 index was 6,930, reached on the last day of December in 1999. This was not even beaten in the great 2003-2007 credit bubble, although it came within 3% of the 1999 high on 9 October 2007.
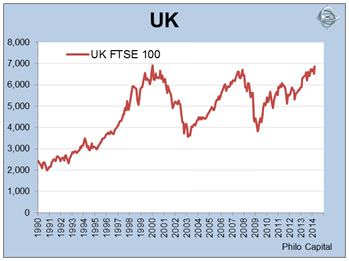
Finally, 14 years after its peak, the long wait for a new high is almost over. On 22 May 2013 the index got to 6840 which was just 1% away from its dot-com peak of 6,930, and it is now (late February 2014) once again closing in on the peak.
The UK economy has drifted in and out of recession since 2008 and has suffered massive bank losses and nationalisations, high unemployment, weak consumer spending and sluggish business investment throughout the period, but share prices have soared.
In subsequent articles in this series we will take a look at the gold, silver and bronze medal markets in more detail and compare them with Australia’s performance (shown below).
Some conclusions
Most of the time economic growth has little to do with stock market performance. For example, Chinese economic growth has been the highest in the world over the past 20 years but it has had one of the worst performing stock markets for just about any period over the same 20 years (apart from a couple of bubble years which collapsed quickly). On the other hand Australia was the only developed economy not to suffer a recession in the GFC and it has had the highest level of economic growth during and since the GFC, but it has had one of the worst performing stock markets during and since the GFC.
A country like Demark can overcome seemingly insurmountable obstacles and unfavourable business conditions and still manage to be a world class high-tech manufacturer and exporter with the best performing stock market in the developed world.
Australia does have some world class companies that compete and win on the world stage (such as CSL, News, Orica, Amcor, Computershare, ALS, Ansell, Ainsworth). However, because they are so rare they tend to be over-priced much of the time. The local stock market is still dominated by big miners and big cosseted oligopolies that control virtually every domestic market segment, including banking, insurance, retailing, food, telcos, gambling, gas, electricity, transport, airlines, and just about every other domestic industry in which listed companies operate. They are protected from real competition by high barriers to entry and by the same tyranny of distance they complain about.
Australian investors have a long standing home bias in favour of local companies and this has often been justified by pointing to the fact that our economic growth rates have been higher than the rest of the developed world. That doesn’t translate into stock market returns. There are many fine global companies that are based in other countries that operate in a whole range of sectors and industries that are not even represented on the local Australian stock market.
Part 2 of this series takes a closer look at the gold medallist Denmark and compare it with Australia.
Ashley Owen is Joint CEO of Philo Capital Advisers and a director and adviser to the Third Link Growth Fund.