Register For Our Mailing List

Register to receive our free weekly newsletter including editorials.

Home / 115

Putting sequence risk in its place

Discussions on sequence or series risk regularly appear in the specialist financial media, and are increasingly appearing in the general press. In simple terms, fear of sequence risk drives investors to take equity and risky asset exposures out of their retirement portfolios.

Sequence risk is the fear that a series of bad returns in the early stages of retirement drawdown will significantly diminish capital values such that the portfolio is incapable of recovery, can't support future drawdowns and will not meet its investor's longer term needs.

Analysis of Australian historical data suggests that sequence risk for retirees may not be the danger claimed. If this is true, then many of the standard approaches to investment within retirement plans are flawed. Specifically, this includes notions of decreasing growth asset exposure with age and deferring home equity release opportunities to later stages of retirement. History actually shows that there are good arguments for increasing growth asset exposure around retirement. We show that this is consistent with the data from three countries: Australia, the UK and the US.

Background

For the last 10 years, FinaMetrica has provided advisers in nine countries with 40-plus years of performance history for a wide range of portfolio asset mixes for both lump sum investments and regular savings from an investor's perspective. In the UK, the rolling 10-year real return for a 40% growth portfolio over the last 40-plus years has been 5.5% p.a, in the US 5.5% and Australia 5.9%. What would have happened if a higher growth asset exposure had been selected? Not as much as might be expected. An 80% UK growth portfolio would have delivered 0.9% p.a. more at 6.4% p.a. In the US 6.9% p.a., a 1.4% increment; and in Australia 7.1% p.a., a 1.2% p.a. increment.

Our data set is based on mainstream accumulation indexes, rebalancing each year. So on face value there has been little additional return for the greater exposure to growth assets and the associated volatility.

Australian withdrawal history shows counter-intuitive outcomes

In our example for 40% growth portfolio using the returns described above, we drawdown $3,000 p.a., $5,000 p.a. and $7,000 p.a., adjusted for inflation each year from a $100,000 portfolio. There is no allowance for fees, taxes or other frictions which can amount to 200 bps (2.0%) or more each year. The real balances after ten years are shown in the main body of the table.

Table 1: Real end value of portfolio based on different drawdown rates (3%, 5% and 7%)

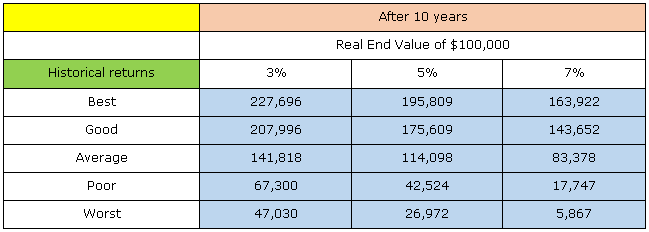
The Good means a result that was higher than 95% of the results and, similarly, the term Poor means a result that was higher than only 5% of the results. The Average is the average return. We can discount the Best and the Good as we shouldn't be over-emphasising high returns to investors. It's the Average, Poor and Worst outcomes that need to be explored.

The account balances alone don't provide any easy insight into the future so we looked to reinterpret the data consistent with the number of future years the real income might continue to be withdrawn at the end of the tenth year. We can divide the closing 'real' balances for future annual payments by $3,000, $5,000 and $7,000 and see the future year payments.

We now have a framework for comparing retirement benefits based on future payments.

  • After 10 years our $3,000 p.a. withdrawing investor had on average 47.3 more years’ payments. In the Poor case (5%) she had 22.4 more years. And the very Worst 15.7 more years.
  • After 10 years our $7,000 pa withdrawing investor had on average 12.3 more years’ payments. In the poor case (5%) she had 2.8 years. And the very Worst 0.8 more years.

How does this compare to the client who took on the additional 40% risky asset exposure and ran with an 80% Growth asset portfolio? We already know that the additional return was 1.2% p.a. in Australia over the last 40-plus years. Averages can hide all sorts of unexpected insights.

  • Best, Good and Average returns are generally consistent with what most would expect. The additional growth asset exposure delivers better returns, much better than might have been expected considering the annualised incremental return was only 1.2% p.a. greater.
  • The Poor and Worst returns are another matter. They are counter-intuitive. Investors didn't necessarily have a lower return for lower growth asset exposure.
  • Investors were not significantly worse off for taking the 40% higher exposure to growth assets.

Comparison of Australia with the UK and US

Is this an Australian aberration? How does this compare to similarly exposed portfolios in the UK and US? (see attached paper for more detail if required).

  • The patterns are similar in both the US and UK to Australia for a 40% growth portfolio across all five cases. There is no significant differences in future year payments for portfolios across countries in Poor and Worst cases.
  • The patterns are similar for the 80% growth portfolio as the 40% growth asset portfolio in both US and UK.
  • Specifically, there's no significant differences in future year payments for portfolios across countries in Poor and Worst cases.
  • A 5% withdrawal rate leaves investors with potential additional payments after 10 years for a further 20.1 years in UK, 19.5 years in US and 26.2 years in Australia in Poor cases. The Worst cases are also consistent.

Is sequence risk an unnecessary anxiety?

So, at least historically, sequence risk looks to be an unnecessary anxiety. It seems to be a case of focusing on one particular part of the portfolio performance data rather than the full context. Reducing equity exposure hasn't changed the Poor and Worst returns in any meaningful way but will have likely impacted Average, Good and Best returns. In summary, the opportunity cost of being underexposed to growth assets was high.

So what are the take-aways?

  • There may be no investment need to reduce growth asset exposures in portfolios around retirement. In fact, there may be an argument to increase it.
  • The best retirement portfolio may be the one that best matches the investors' financial risk tolerance with assets. On that basis they are less likely to be carried away by stock and property market movements.
  • Our collection of 800,000 risk tolerance test reports shows that there's little likelihood of material change to an individual's risk tolerance as they age. What changes is their perception of risk as markets move and other factors change.
  • The role of annuities in an individual's retirement portfolio needs to be carefully considered.
  • Short-term cash flow needs may be best financed by low cost borrowings, through a reverse mortgage for instance. And repaid when equity markets recover.
  • When markets are in disarray investors may choose to spend less.

Retirement planning has never been so challenging.


For more detail on the calculations, including relevant tables on the results and a comparison with the UK and US, see the full research paper. This article is for general education purposes and does not address the specific circumstances of any individual investor.

Paul Resnik is a co-founder of FinaMetrica, which provides best-practice psychometric risk tolerance testing tools and investment suitability methodologies to financial advisers in 23 countries.

Peter Worcester has spent 40 years working in the financial services industry.  He is an actuary, has been a director of several financial planning firms, and has been an investment manager with several firms.


13 Comments
Paul Resnik & Peter Worcester
July 17, 2015

We have several interesting and insightful comments above.

When we are dealing with future expectations, we need to take into account the following points:
1. The current position in the economic and financial markets cycles
2. We can only use past experience as a guide to the future
3. Experience has shown that the timing of future returns is always unpredictable. In particular, “Black Swan” events are even less predictable as to their timing, size and duration. In 2008, we experienced the slowest moving “train wreck” we have ever seen. In 1987, the Australian equity market fell 25% in one day.

A lot of the comments relate to specific examples of whether or not people retired just prior to, or just after, a major market correction.

The comments suggest that an individual’s appetite for risk would be a lot lower after a market correction.

If the financial planner has done their job properly, the client would understand that equity markets fall around 50% every ten years or so. As a consequence, the client’s portfolio would be structured so that the client, while not happy when such a fall occurs, is not shocked. Consequently, the client would not reduce their equity exposure at the bottom of the market.

FinaMetrica’s experience has shown that the risk appetite for an individual client does not change over time.

Consequently, the act of retirement should not effect a change in an individual’s risk profile, and hence their portfolio construction.

The only change should be in the tax treatment of the portfolio.

Aaron Minney
July 08, 2015

Hi Peter and Paul
Having had a look at your full paper, I think there is one missing piece in your analysis.

Using your numbers and the 5% drawdown (taking this as the sensible choice):
A retiree would expect to afford 33 years in retirement (10+22.8) with a 40% growth allocation. There is some conservatism here, so a bequest is looking likely.
A retiree with 80% growth allocation is looking forward to a total of 37 years.

A risk is that something goes wrong- using your poor returns in the first 10 years.
the retiree with 40% growth will now only enjoy 18.5 years, and the retiree with 80% will make it 20.5 years. These are well short of expectations by 15-17 years.

Given that neither of these retirees would make actual life expectancy, how can either be considered a good result!

Granted, reducing the overall exposure to growth assets does not help.

The real question is whether anything else can.

Papers by Pfau and Kitces in the US and Kingston and Fisher in Australia highlight that changing allocations to growth assets over time can deal with the issue better: the v-shaped lifecycle.

I agree that the role of annuities should be carefully considered. Partial annuitisation (while maintaining the exposure to growth assets) can reduce the impact on actual spending for the retiree when the sequence of returns is unfavourable.

Geoff Walker
June 28, 2015

Hi Harry. My criticism was directed at your statement “Ask ANY person who retired …” rather than being an outright rejection of sequencing risk. Also, I think you should reread the second para following your quote in my original comments.

Although my example referenced a portfolio of blue-chip dividend-paying Australian shares, that was not essential to the conclusion reached, nor was your inference of “not drawing on capital”. What was essential was that the portfolio would experience substantial market-value volatility, and the most common way that this occurs for retirement investors is through investment in this class of assets.

Unfortunately, your counter-example addresses the issues of dividend volatility and portfolio concentration rather than the issue at hand. So let me re-do that example correctly by testing your assertion that ANYONE who defers their retirement over a year in which the market falls substantially is going to find their retirement lifestyle constrained relative to their pre-deferral potential, due to sequencing risk.

I also must point out that in calculating “your” 1991 income you overlooked the fully-franked dividend of 15¢ per WBC share paid on 5 July that year, so that your “actual” income for 1991 was not $51,000 but rather $78,000. But otherwise accepting your data (including the assumed corporate tax rate of 30% rather than the then-actual 39%) we get the following situation for the investor who deferred his retirement until the beginning of 1991.

Grossed-up dividends less tax received during 1990 : 85% x $97,000 = $82,400
Additional shares purchased at 1990 year end = $82,400/$3.32 = 24,820
Total shares held during 1991 = 129,259 + 24,820 = 154,079
Grossed-up dividends received during 1991 = 154,079 x $0.425/0.7 = $94,000

And $94,000 is of course substantially higher than the $78,000 “you” received in 1991.

So, when done correctly, your example shows that the investor who deferred his retirement for a year during which both the market price and the dividends fell achieved more income in 1991 than did the investor who retired the year before, thereby yet again refuting your assertion.

Let me state that it doesn’t matter whether we are talking about high-yielding or low-yielding investments, or whether the market price and/or dividends go up or down during the year of deferment, or whether capital is drawn on. As long as the portfolio remains the same and investments are yielding cash income, then that income received during the year of deferred retirement can be used to purchase additional shares, or units. And these additional shares or units will then give rise to a greater income in the first year of retirement compared with that received in the same calendar year by the investor who retired a year earlier.

Geoff Walker
June 26, 2015

“Ask ANY person who retired at the end of 2008 & so witnessed a 19.7% fall in their retirement nest egg during that year. Their standard of retirement lifestyle has been constrained (relative to their pre-2008 potential) every year since due to sequencing risk.”

Wow, what a wild generalisation! Fools rush in where angels fear to tread. While Harry may well be no fool, he has certainly rushed in.

I’ve just done a simple example of someone who retired at the end of 2008 rather than 2007 and is now enjoying noticeably better income. To keep the calculations simple I picked Westpac as a proxy for his SMSF portfolio invested wholly in blue-chip dividend-paying Australian shares.

If that investor retired at the end of 2007 when his portfolio held 25,000 WBC worth $698,000, the SMSF would have received dividends in 2008 of $50,750 (including franking credits). That would have fallen to $41,500 in 2009 but since then would have climbed to $65,000 in calendar 2014.

But had that investor postponed his retirement to the end of 2008, his portfolio at retirement would have been worth only $467,000 (including the extra 2,540 shares his SMSF would have purchased at year end with the dividends, net of 15% tax, received over 2008. That’s a fall of almost exactly ?, far larger than Harry’s 19.7%.

A sequencing-risk-driven calamity for the investor? Far from it, since the SMSF would have received dividends in 2009 of over $45,000 increasing to over $71,000 last year. That’s 10% better than had he retired at the end of 2007 despite the ? fall in value by the end of 2008!

And it could be even better than that. I’ve assumed that the investor drew down a pension equal to the full dividend stream, over $45,000 in 2009, received by his SMSF, which equated to nearly 10% of the opening balance, $467,000 at the end of 2008. Had he instead drawn down just the minimum 4% of the opening balance each year, as do many SMSF pensioners, there would have been surplus dividend income left in the SMSF each year, leading to the purchase of still more WBC and therefore still more dividends and pension payments.

The illustrative results of this example would apply to anyone who maintained a shares-oriented portfolio over the period and didn’t succumb to the advice of well-meaning advisers to change horses midstream and switch out of their shares at retirement, bad advice which would have resulted in temporary market-value fluctuations being crystallised into permanent losses.

Harry Chemay
June 28, 2015

Geoff, thank you for crafting such a cogent response to my earlier comment. Might I say I am humbled that you would take the time and effort to back-test my hypothesis that sequence risk is real and relevant, citing evidence to reject it outright. I too love a good back-test, but more on that later.

If I understand your line of argument correctly, you suggest that by holding retirement assets in a SMSF, not drawing on capital (selling any existing investments) and living off the dividend stream produced by a "portfolio invested wholly in blue-chip dividend-paying Australian shares", an investor's retirement lifestyle would not be impacted by shorter-term share price declines. You certainly have provided a compelling case study in favour of this supposition.

Not every retiree of course has a SMSF, and few Australians retire with anything near $698,000 in superannuation. Far from it as it so happens. The popular retirement income vehicle for Australians of more modest means is an account-based pension issued by a retail or industry superannuation fund for which the retiree receives units in one or more investment options. These units must then be periodically sold to meet the retiree's preferred pension payment frequency (which for many is either fortnightly or monthly ), at the then prevailing price.

The average Australian therefore does not have the luxury of harvesting passive income without constantly engaging with market prices. My concern is for these retirees who have neither the asset pool, recourse to a non-unitised investment structure, or the financial ability or desire to engage an adviser.

Now about that case study. You used a single recently high performing, high dividend paying company, Westpac Bank (WBC), to make your case. I find this use of a single shareholding as proxy for an entire SMSF portfolio intriguing. It would be remiss of me not to mention the investment covenant rules in section 52B 2(f)(ii) of SISA that require SMSF trustees to take account of "the composition of the fund's investments as a whole including the extent to which the investments are diverse or involve the fund in being exposed to risks from inadequate diversification." Perhaps there is a registered SMSF auditor out there who is prepared to sign off on a $698,000 SMSF with its entire assets in one company. But I digress.

Getting back to the task at hand I, like you, have run a 3 year back-test on an all-WBC portfolio held within a SMSF. The only difference ? My years are 1990, 1991 and 1992. My portfolio starts with the purchase of 129,259 WBC shares on 2 January 1990 at $5.40 per share (yeah I know, how cheap was that?). With my new $698,000 WBC-only portfolio, I'm now ready for a retirement of idle bliss. To keep our respective outputs consistent I'm going to assume that my WBC fully-franked dividends receive the same tax treatment as per your calculations (nil tax and a 1.4286 franking credit gross-up factor).

During 1990 my WBC shares pay 52.5 cents in dividends so I earn some $97,000. Yes, that a grossed-up dividend yield of close to 14%. My portfolio's taken a tumble though, falling 39% to $429,000. As my only concern is to live off the WBC dividends I shrug my shoulders and toast the new year with a flute of Bollinger. 1991 however sees me cancel my Christmas ski trip to Vail, as my SMSF portfolio delivers not $97,000 but $51,000. My dividend income has fallen by almost 50% in the space of 12 months. I have a $95,000 lifestyle and most certainly can't live on less than $50,000, so I force a smile at the neighbours as I see in 1992 with a Semillon of questionable pedigree.

Surely things will turn in my favour in the new year? I need at least $50,000 but alas the stock-market is a fickle mistress. 1992 sees my SMSF generate a paltry $33,000, a fall in my income since retirement of over 65%. WBC has a disastrous year, writing off $2.7bn in bad debts and declaring a full-year loss of $1.6bn. Newly appointed CEO David Morgan refers to it as a 'near death experience'. The 1990 dividend of 52.5 cents has been slashed to 18 cents for 1992 (and would fall to 12 cents in 1993. WBC shareholders go on to receive unfranked dividends in 1994 and 1995 and would not see 52.5 cents or more until 2001).

It's now early 1993 and I have a dilemma. I want $95,000, can't live on less than $50,000 and my SMSF is only generating $33,000. I have to sell some shares to make up the difference. Unfortunately WBC isn't worth $5.40 anymore. It trades around $3.20, 41% lower than at acquisition, but I now have no choice. I reluctantly dial my broker (we are talking 1993 here). My SMSF portfolio is worth $413,000. I am just about to experience sequence risk writ large.

Wade Matterson
June 26, 2015

As pointed out by a number of the previous commenters, there are some significant issues contained within this analysis.

In some respects, this is borne out through utilising long-term returns to explore what is essentially a short-term issue. As work by Morningstar has highlighted, investment volatility indeed has an impact on the return that is received by the investor. This negative spread between the return on any given asset class and what the investor receives increases, along with volatility due to the impact this has on behaviour.

Our own work (http://au.milliman.com/insight/2014/The-6-rule-Determining-portfolio-withdrawal-rates-using-stochastic-analysis-and-managed-risk-equities/) with respect to sequencing risk highlights that improved outcomes can be obtained through avoiding or mitigating the worst returns - even when retaining reduced participation when markets are performing well.

Throw in the age-pension, means-testing and individual objectives, and the complexity of these issues increases substantially.

Rob
June 26, 2015

I agree with all 4 commentators, but have some further issues to raise.

You have undertaken an interesting exercise in looking back at what an investor might have received on the basis of having been invested in a particular "static" asset allocation and consumed income at a "static" withdrawal rate. Although interesting from an academic or theoretical perspective, it does not serve people who live in the "real" world where there is no time machine.

In other words, "investors do not eat past returns" or my personal favourite, "you don't drive a car looking in the back mirror". It is much more relevant to use a modeling approach that is forward-looking approach. If such an approach is done prudently, then the outlook over the next 10 years is not as favourable as your data indicates.

Now to sequencing risk itself. Take the case of Joe (retiring at the end of 2007) and Bob (retiring at the end of 2008) who both have $200,000 in their super at the end of 2007. In 2007, both Bob and Joe were looking to retire on the same nest egg. Both were invested in your 40% growth portfolio in 2007, except that Joe bought an annuity at the end of the year to secure his income, while poor Bob stayed in the 40% growth portfolio. By the end of 2008, Bob was distraught as his super was now only worth $179,000. If taking your advice poor Bob went to the 80% growth portfolio his (not so) super was worth $142,000. Now why don't you console poor Bob by giving him a copy of your Research Paper!

Paul G
June 26, 2015

Page 20 of "How Safe are Safe Withdrawal Rates in Retirement? An Australian Perspective" by Drew and Walk (2014) provides more detail:

https://www.finsia.com/docs/default-source/industry-reports-retirement-risk-zone/how-safe-are-safe-withdrawal-rates-in-retirement-an-australian-perspective.pdf?sfvrsn=4

Good luck to anyone who attempts a study of safe withdrawal rates that takes into account income received from the age pension!

Peter Vann
June 26, 2015

Paul G
Why “good luck…”?

Chris Condon and I have developed some technology to undertake these calculations using approximate closed form maths (not slow Monte Carlo simulations). The calculations behind the chart in my link above can include or ignore the age pension. For the technically minded, this results in a stochastic age pension due to the stochastic nature of future investment returns.

I’m mindful that we have to make an assumption regarding how the relevant parameters in the assets and income tests change in the future, e.g. rise with inflation, but doing that allows some insights to the impact of the age pension on safe withdrawal rates etc.
Peter

Paul Resnick
June 26, 2015

We will respond to comments when we've had a few more and seen what the issues are.

Peter Vann
June 26, 2015

Hi Paul & Peter

I agree that sequencing risk needs to be placed in context of real life experience. For example, if one includes reversion of valuations, then the often discussed sequencing risk actually reverses for many. For example, a 55 year old may welcome a significant equity market fall that takes PEs well below some normal range as some of the future contributions will buy cheap assets, and just at the time the accumulator is possibly looking at toping up contributions. In this situation forecast safe withdrawal rates in retirement will rise.

But the one point that I would like to make is around the discussion of account balances. These cloud the outcomes and it is more informative to present withdrawal rates (but not based on averages). A member currently earning, say, $70,000 p.a. should understand the impact of a statement such as

“when you retire, your superannuation savings have a good chance of proving an income of $60,000 per annum well past your life expectancy”.

The statement presents retirement outcomes in a paycheque which is language most workers should understand. Furthermore, this something they can relate to current income. Not much financial literacy required to understand that $60k is a bit less than their current income of $70k. Note that the above statement also introduces a consequence of investment volatility, “you have a good chance….”, in hopefully simple language (language the public is now being exposed to courtesy of the BOM web site).
Then charts such as that illustrated in some work that Chris Condon and I have undertaken
http://ccfs.net.au/cvs/content/Why-most-retirement-income-calculators-are-misleading.pdf

can form the base of more “what-ifs”, what is the impact of withdrawing more, what if I want higher certainty, what if I expect to live longer, what if I save more, what is the impact of actual experience.

Then if one utilises this information over time you have a dynamic system that can manage the impact of so called sequencing risk, changing longevity risk and member behaviour (Chris and I call this the Retirement Income Manager).

Then one can actually start undertaking member risk analysis since the risk being focused upon is risk relating to funding retirement expenditure.

Peter

Harry Chemay
June 25, 2015

Reading this article left me confused. Reading the research paper linked to it provided no great relief. The methodology used appears to ignore how actual retirees experience returns.

The authors appear to use long-term averages in their calculations, but retirees who are living off their nest eggs do not receive long-term average returns as they consume income and/or capital. They receive moment-to-moment and day-to-day returns, many of which will be significantly below these long-term averages. Having to sell into these occasional declines to meet pension payments (often fortnightly or monthly in the case of account-based pensions) can result in significant variability in 'time to portfolio ruin'.

In short, the authors have succumbed to the 'Flaw of Averages'. Great for academic theorizing, but inadequate to investigate the real-world effects of sequencing risk. It is very much real. Ask any person who retired at the end of 2008 & so witnessed a 19.7% fall in their retirement nest egg during that year. Their standard of retirement lifestyle has been constrained (relative to their pre-2008 potential) every year since due to sequencing risk.

David
June 25, 2015

You've made a convincing argument that (historically) a 5% withdrawal rate was risky no matter your asset allocation and that a 3% withdrawal rate was fairly robust to static asset allocation.

Typically a retiree wants to find a withdrawal rate that is robust enough (not 5%) but gives them sufficient quality of life. Those with relatively low amounts of savings (such that 3% is insufficient) want to know where the edge between these two scenarios is likely to be. That's where asset allocation and guaranteed floors from pensions and fairly-priced lifetime annuities may be able to make a difference.

I also question your data. Four non-overlapping 10-year periods may be all the quality data that we have but it's not a basis for drawing such strong conclusions. There's also a focus on 'winning' countries for much of that period, as well as more diversification than most individuals had access to for the first 20-years of that period (international investing). Even in recent history it's not clear that a Japanese investor would have been so lucky.

While his book isn't perfect, Jim Otar's "Unveiling the Retirement Myth" looks at a far more comprehensive data set and its conclusions are far less pleasant. Wade Pfau has numerous papers and articles, often using a longer US data history, that also come to very different conclusions.


Leave a Comment:


RELATED ARTICLES

Risk in retirement: five strategies for finding the right balance

A simple method to help mitigate sequencing risks

Sequencing risk can hit retirement outcomes

banner

Most viewed in recent weeks

11 ASX dividend stocks for the next decade

What are the best stocks to own that can pay regular dividends and beat indices on a total return basis in the long-term? Here is our list of 11 ASX-listed companies that could help investors achieve these goals.

2024/25 super thresholds – key changes and implications

The ATO has released all the superannuation rates and thresholds that will apply from 1 July 2024. Here's what’s changing and what’s not, and some key considerations and opportunities in the lead up to 30 June and beyond.

Time to smash the retirement nest egg - but how?

For decades, governments told people to save for retirement, then hold onto their nest eggs. Now, they're concerned that retirees aren't spending enough. How can we encourage reasonable spending patterns in retirement?

The greatest investor you’ve never heard of

Jim Simons has achieved breathtaking returns of 62% p.a. over 33 years, a track record like no other, yet he remains little known to the public. Here’s how he’s done it, and the lessons that can be applied to our own investing.

Five months on from cancer diagnosis

Life has radically shifted with my brain cancer, and I don’t know if it will ever be the same again. After decades of writing and a dozen years with Firstlinks, I still want to contribute, but exactly how and when I do that is unclear.

Welcome to Firstlinks Edition 552 with weekend update

Being rich is having a high-paying job and accumulating fancy houses and cars, while being wealthy is owning assets that provide passive income, as well as freedom and flexibility. Knowing the difference can reframe your life.

  • 21 March 2024

Latest Updates

Retirement

The challenges of retirement aren’t just financial

Debates about retirement tend to focus on the financial aspects: income, tax, estates, wills, and the like. Less attention is paid to the psychological challenges of retirement, which can often be more demanding.

Strategy

Is Australia ready for its population growth over the next decade?

Australia will have 3.7 million more people in a decade's time, though the growth won't be evenly distributed. Over 85s will see the fastest growth, while the number of younger people will barely rise. 

Taxation

The mixed fortunes of tax reform in Australia, part 1

While there have been numerous tax reviews at the Commonwealth and state levels, most have not resulted directly in substantive tax reforms. This two-part series looks at that history and explores the pathway forward. 

Investment strategies

America, the world's new energy superpower

The US has become the world's new energy superpower, combining production, technology and capital in a way never previously achieved – a development sure to have global implications for decades to come.

Investment strategies

Could Korean corporate reform trigger a Japan-style market rally?

Corporate governance reforms in Japan have helped spur a 45% rise in the share market over the past 12 months. Korea looks set to follow the Japanese reform playbook, and may be poised for a similar bounce.

Property

How AI will transform the real estate sector

The real estate industry, traditionally characterised by its cautious adoption of new technologies, is now at a pivotal juncture. The emergence of AI promises to fundamentally change the way we live, work, and play.

Investment strategies

Charitable giving and tax deductions

With impending Stage 3 tax cuts incentivising taxpayers to bring forward future tax deductions while tax rates are higher, it’s a good time to explore how to bolster your tax savings and community impact through structured giving.

Sponsors

Alliances

© 2024 Morningstar, Inc. All rights reserved.

Disclaimer
The data, research and opinions provided here are for information purposes; are not an offer to buy or sell a security; and are not warranted to be correct, complete or accurate. Morningstar, its affiliates, and third-party content providers are not responsible for any investment decisions, damages or losses resulting from, or related to, the data and analyses or their use. To the extent any content is general advice, it has been prepared for clients of Morningstar Australasia Pty Ltd (ABN: 95 090 665 544, AFSL: 240892), without reference to your financial objectives, situation or needs. For more information refer to our Financial Services Guide. You should consider the advice in light of these matters and if applicable, the relevant Product Disclosure Statement before making any decision to invest. Past performance does not necessarily indicate a financial product’s future performance. To obtain advice tailored to your situation, contact a professional financial adviser. Articles are current as at date of publication.
This website contains information and opinions provided by third parties. Inclusion of this information does not necessarily represent Morningstar’s positions, strategies or opinions and should not be considered an endorsement by Morningstar.