Register For Our Mailing List

Register to receive our free weekly newsletter including editorials.

Home / 32

Hold the champagne, that’s not a recovery yet

A milestone of sorts was passed by the Australian stock market this month. The total return index for the broad market (the All Ordinaries Accumulation Index, which includes re-invested dividends) finally clawed its way back to its November 2007 peak after nearly six years ‘underwater’.

Six years may seem a long time to wait for a recovery, but in fact the real situation is worse. In terms of the real value of wealth after CPI inflation, the real total return index is still some 14% below its peak.

Our first chart shows the accumulation index (and its predecessors) since 1900, adjusted for CPI inflation.

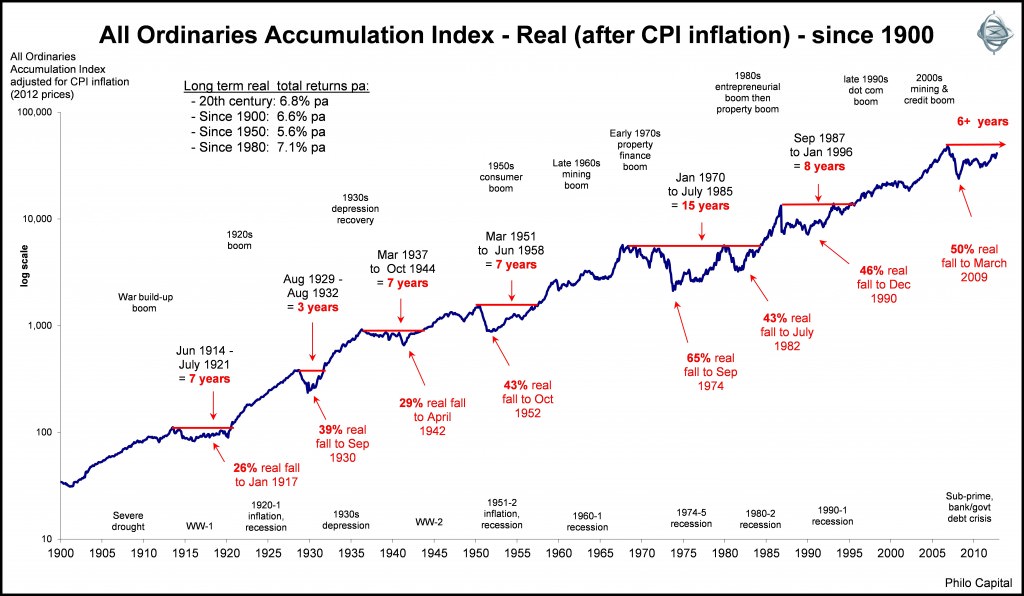
The global financial crisis of 2008-9 was not a ‘once in a century’ or ‘black swan’ event as it was made out to be. There have been plenty of crashes of similar size or worse in the Australian market. Major collapses like these have occurred every decade or so, and it has almost always taken longer than six years to recover.

Why is it relevant to look at this peak-to-recovery performance? Is it fair to look at performance starting from the boom-time peaks?

It is important because, sadly, many thousands of investors were enticed into the market right near the top by the media frenzy in the height of the boom. Adding to the flurry of share buying was the government’s $1 million window for lump superannuation contributions that closed in June 2007. The impact of this government measure was very similar to the introduction of franking credits in July 1987. In both cases, large numbers of investors were caught up in the frenzy, sold other assets (incurring tax liabilities in many cases) and bought shares or contributed to super funds that in turn bought shares at the height of the boom, only to see their values halve in the crash that followed shortly after.

In both cases the flood of extra money from new investors pushed share prices even higher in the boom, meaning they had further to fall in the bust that followed.

Price index

Looking at total returns like this is academic for many investors because the total return index assumes religious reinvestment of all dividends over the whole period. Retirees who live off the dividend income are more interested in share prices and not total returns, since they spend the dividends.

If we look at the real price index (adjusted for CPI inflation) we see a different story:

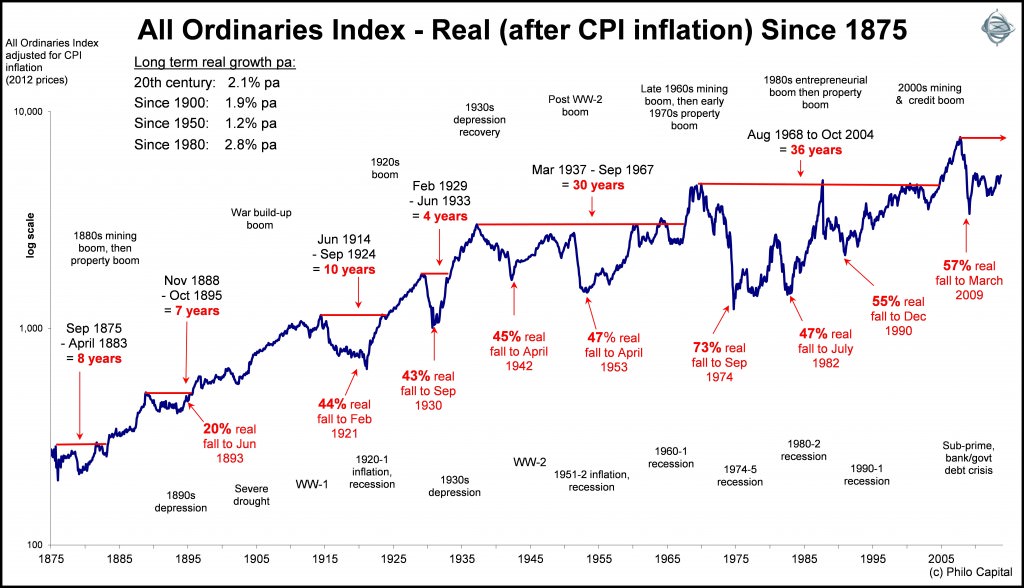
Here we see two separate periods in which it took 30 years or more for the broad diversified share price index to recover. That’s a whole generation at a time waiting for the market to recover from crashes after booms, which is when many people buy into the market.

Readers with a keen eye will notice that the All Ordinaries index today is barely above its August 1968 peak in real terms after inflation some 45 years later. Actually it’s up just 0.5% pa. That’s 45 long lean years of virtually zero price growth for people who bought into the large index stocks at the height of the boom.

What were those stocks that dominated the index 45 years ago? It’s mainly the same old companies that dominate it today (with some exceptions, notably CBA which was floated in 1991). Of the big cap stocks in 1968, the share prices of Bank of NSW (Westpac), BHP, AGL, Woodside and QBE are all less than 3% pa ahead after inflation (and after adjusting for capital structure changes). However the share prices of ANZ, NAB, CRA (RIO), Santos and Lend Lease are all still below their 1968 boom time highs - after 45 years!

That’s 45 years to wait just to get back to square after inflation, let alone make any real capital growth, for those who bought in the boom.

These are broad index returns that are largely driven by the largest stocks. Many investors don’t just stick to the boring big stocks at the height of booms. Many are lured into speculative 'hot stocks', and most of these inevitably disappear altogether in the crashes that follow the speculative booms.

How long to recover the 2007 peak?

Even for those investors who did avoid the 'hot stocks' and stuck to the big boring companies, it will probably be many, many years before the All Ordinaries index recovers to its 2007 boom-time high in real terms after inflation. Today the index is around 5,200 and the November peak level was 6,853 so the market index will need to rise by a further 32% from current levels to get back to the peak level.

However, the inflation-adjusted November 2007 peak target is now 7,900 and climbing steadily with inflation. It would require the market to rise by another 50% from current levels to get back to the inflation-adjusted peak.  If that takes another say three years to achieve, then that’s three more years of inflation of say 2.5% each year. That raises the target by another 8%, which means it would require a rise of 64% from today’s level to achieve over three years. That’s a big ask.

Inflation is a silent destroyer of wealth, and it is a major reason why it takes such a long time to recover from busts.

It will be a long, long wait for those who bought in the boom, but that is the way it has always been. Investors who bought the 'time-in-the-market' and 'buy & hold' myths and the efficient markets hocus pocus will have a very long wait indeed.

This story refers to the returns from the broad diversified index. Let’s not forget that most fund managers fail to beat even the broad market index after taxes and fees. In future instalments I will cover the return histories of individual companies to see which fared better or worse than the broad diversified index over time.


Ashley Owen is Joint Chief Executive Officer of Philo Capital Advisers and a director and adviser to Third Link Growth Fund.


7 Comments
Geoff Walker
September 20, 2013

"Retirees who live off the dividend income are more interested in share prices and not total returns, since they spend the dividends."

Speaking as a retiree who lives off dividends, I beg to differ. I have not the slightest interest in share prices. I'm interested in profits since that's where dividends are generated.

Since 1968 index dividends have gone up something like 25-fold, well in excess of CPI inflation up something like 12-fold.

Warren Bird
September 20, 2013

It doesn't surprise me at all that the stock price index in real terms hasn't gone up all that much over the long haul.

The nominal returns from the stock market as a whole are pretty much limited to the nominal growth rate of the economy over time. They can do a little better if the 'exports share' of listed company earnings is higher than the % of exports that make up total GDP and exports growth is faster than domestic growth. A high exports share would seem to be the case given the importance of mining to the ASX. There can be swings and roundabouts as listed companies do better or worse than unlisted, and as the profit share versus wages share of national income shifts. But overall it's not physically possible for the whole market to beat the economy by much over long periods of time.

And since companies have historically paid dividends at a higher yield than the long run real growth rate of the economy, that leaves little or no room for any real capital appreciation of the underlying share prices. So in fact I'd say the overall market has done well to be at the same real level in 2013 as it was in 1968.

The big swing in the 1970's was the increase in the wages share of GDP, which hit stock prices hard in nominal and real terms. We didn't really get a recovery until the important economic reforms of the 1980's, which lifted the profits share again and enabled the recovery of real share prices.

ashley
September 20, 2013

Hi Warren,
I remember a cold rainy night in 2009 in Sydney where I saw hundreds of people lining up around the block, huddled and shivering, clutching onto broken umbrellas in the driving rain. It was the same around the world in every major city.
For a brief moment I thought "this might be it - its like the 1930s depression. They're lining up for soup kitchens". It wasn't of course, it was just the release of the new iphone!
The GFC was no great depression - nothing like it. The only dilemma millions of people face around the world was how many iphones to buy and what colour! In the 1930s unemployment was 30%+ with virtually no welfare safety nets. Now we have 6% unemployment which only 20 years ago was defined as "full employment"!
On a host of different criteria the GFC was not even as serious as the 1970s....but that's another story for another day.
cheers
ashley

Peter Beck
September 20, 2013

Thanks for this article. This is my personal favorite chart. Clearly I have some Actuarial genes in my DNA!!!
Most Actuarial work is based upon a principle that real returns are constant over the long run for different asset classes and vary only by the risk of the asset class.
This is a good reminder to consider both the long term and the short term and think real returns.The million dollar question is in the short term are we at, above or below normal. We generally assume normality at all times in Actuarial work which makes no sense in the short term. You make a good case for still being below normal. Fortunately most of Actuarial work is long term so taking a short term position tends to be a rounding error in the long term rates we use. I look forward to following the commentary.

Craig James
September 19, 2013

To focus just on share prices and ignore dividends is too simplistic nowadays as dividends are a greater focus for investors. Its not just re-invested dividends - the dividends are paid and investors have income to use. Its always important to remember that the share price index is only relevant if people actually cash in their gains. And the main reason why the All Ords and ASX 200 have further to go is heavyweight mining shares. For investors of commonly held shares such as banks, retailers and telcos, the champagne is already flowing.

ashley
September 19, 2013

hi aaron,
yes and no about having to have plenty of other income from elsewhere so one can reinvest the dividends. Having other income elsewhere usually means fixed income from bonds or cash. Cash pays negative real rates in 40% of all years, and goes backwards after inflation unless the interest is reinvested. Bonds are probably about to enter a 20+ year bear market so will probably go backwards after inflation (even if interest is reinvested - like 1900-1921 and 1946-1980). So that leaves property (prone to speculative bubbles and low yield after all the costs), and shares for real growth in dividends. So most long term retirement funds require real assets like shares or infrastructure to preserve real value of cashflows. Either way the income is needed to fund living expenses so we are left with the capital which, at best rises by 1-2% pa in real terms. Like all things in life - timing is critical.
cheers

ashley

Aaron
September 19, 2013

Some great points Ashley. I agree wholeheartedly.
I think many people miss the significance of the 45 year no real gain in share prices; or even the extended times when real price returns over 30+ years were negative. This eats away at retirement. If retirees are going to invest in these assets, they should ideally have enough income from other sources to reinvest their dividends. To rely on the dividends keeping up with inflation is just loading up on risk and hoping it will be okay.


Leave a Comment:


RELATED ARTICLES

How inflation impacts different types of investments

Aussie shares: 50 years and we’re finally ahead

Equities deliver high returns and low volatility - again

banner

Most viewed in recent weeks

2024/25 super thresholds – key changes and implications

The ATO has released all the superannuation rates and thresholds that will apply from 1 July 2024. Here's what’s changing and what’s not, and some key considerations and opportunities in the lead up to 30 June and beyond.

The greatest investor you’ve never heard of

Jim Simons has achieved breathtaking returns of 62% p.a. over 33 years, a track record like no other, yet he remains little known to the public. Here’s how he’s done it, and the lessons that can be applied to our own investing.

Five months on from cancer diagnosis

Life has radically shifted with my brain cancer, and I don’t know if it will ever be the same again. After decades of writing and a dozen years with Firstlinks, I still want to contribute, but exactly how and when I do that is unclear.

Is Australia ready for its population growth over the next decade?

Australia will have 3.7 million more people in a decade's time, though the growth won't be evenly distributed. Over 85s will see the fastest growth, while the number of younger people will barely rise. 

Welcome to Firstlinks Edition 552 with weekend update

Being rich is having a high-paying job and accumulating fancy houses and cars, while being wealthy is owning assets that provide passive income, as well as freedom and flexibility. Knowing the difference can reframe your life.

  • 21 March 2024

Why LICs may be close to bottoming

Investor disgust, consolidation, de-listings, price discounts, activist investors entering - it’s what typically happens at business cycle troughs, and it’s happening to LICs now. That may present a potential opportunity.

Latest Updates

Shares

20 US stocks to buy and hold forever

Recently, I compiled a list of ASX stocks that you could buy and hold forever. Here’s a follow-up list of US stocks that you could own indefinitely, including well-known names like Microsoft, as well as lesser-known gems.

The public servants demanding $3m super tax exemption

The $3 million super tax will capture retired, and soon to retire, public servants and politicians who are members of defined benefit superannuation schemes. Lobbying efforts for exemptions to the tax are intensifying.

Property

Baby Boomer housing needs

Baby boomers will account for a third of population growth between 2024 and 2029, making this generation the biggest age-related growth sector over this period. They will shape the housing market with their unique preferences.

SMSF strategies

Meg on SMSFs: When the first member of a couple dies

The surviving spouse has a lot to think about when a member of an SMSF dies. While it pays to understand the options quickly, often they’re best served by moving a little more slowly before making final decisions.

Shares

Small caps are compelling but not for the reasons you might think...

Your author prematurely advocated investing in small caps almost 12 months ago. Since then, the investment landscape has changed, and there are even more reasons to believe small caps are likely to outperform going forward.

Taxation

The mixed fortunes of tax reform in Australia, part 2

Since Federation, reforms to our tax system have proven difficult. Yet they're too important to leave in the too-hard basket, and here's a look at the key ingredients that make a tax reform exercise work, or not.

Investment strategies

8 ways that AI will impact how we invest

AI is affecting ever expanding fields of human activity, and the way we invest is no exception. Here's how investors, advisors and investment managers can better prepare to manage the opportunities and risks that come with AI.

Sponsors

Alliances

© 2024 Morningstar, Inc. All rights reserved.

Disclaimer
The data, research and opinions provided here are for information purposes; are not an offer to buy or sell a security; and are not warranted to be correct, complete or accurate. Morningstar, its affiliates, and third-party content providers are not responsible for any investment decisions, damages or losses resulting from, or related to, the data and analyses or their use. To the extent any content is general advice, it has been prepared for clients of Morningstar Australasia Pty Ltd (ABN: 95 090 665 544, AFSL: 240892), without reference to your financial objectives, situation or needs. For more information refer to our Financial Services Guide. You should consider the advice in light of these matters and if applicable, the relevant Product Disclosure Statement before making any decision to invest. Past performance does not necessarily indicate a financial product’s future performance. To obtain advice tailored to your situation, contact a professional financial adviser. Articles are current as at date of publication.
This website contains information and opinions provided by third parties. Inclusion of this information does not necessarily represent Morningstar’s positions, strategies or opinions and should not be considered an endorsement by Morningstar.