Register For Our Mailing List

Register to receive our free weekly newsletter including editorials.

Home / 72

The defined contribution obsession with liquidity

This is the first of a two-part series exploring the focus on liquid assets in defined contribution schemes.

Superannuation is a long-term investment strategy. This is being reinforced by proposed increases in the retirement age and trend towards new investment models (like life cycle investing) looking ‘through’ retirement age for investment strategy. The focus on long term investing should therefore be of paramount importance for superannuation investors.

However, in contrast to the approaches of other long-term investing institutions, the defined contribution (DC) market seems to be obsessed with very ‘liquid’ investments. Liquid here means the ability to convert investments to cash in a speedy manner (or to be ‘cashable’). This trend is particularly evident in Australia as its DC system is one of the largest and well established in the world.

Spot the difference

Comparable long-term investing institutions with superannuation funds include Sovereign Wealth Funds (SWFs), family offices, defined benefit (DB) pension funds, foundations and university endowments. Each has a long-term horizon to meet their investment objectives. Each views its strategic asset mix as a significant decision which establishes the investing framework. And each of these uses a blend of external and internal advisors to assist in setting their long-term asset mix. Essentially, they pay to receive the best advice globally on how to manage money over the long term. So how do they manage their money?

Table 1 illustrates how these long-term investors set out their strategic asset investing framework. Less liquid assets include alternative assets such as direct property, private equity, infrastructure, hedge funds, real assets, timber, physical natural resources and other physical assets:

Table 1: Long-term investors, typical strategic asset allocation


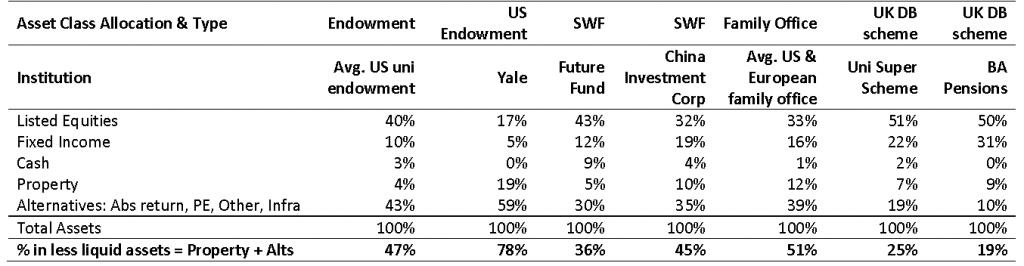
Source: Latest annual reports and accounts of each institution; Wharton study of global family offices.

The percentage of less cashable assets for these types of long-term investors ranges from a low of 19% to a maximum of 78%.

The table also identifies one of the icons of alternative investing, Yale Endowment, which boasts the highest allocation to less cashable assets at 78%. Despite living through the global financial crisis, Yale still maintains this allocation, including a substantial 32% to private equity and 18% to absolute return strategies. Its long-term performance is 13.5% per annum over the past 20 years, a track record that is the envy of many other institutions. And despite holding only 22% of its assets in liquid cashable form, the endowment still contributes 34% of the Yale University operating budget. Some commentators would claim that this focus on long-term, less liquid strategies is the hallmark of a true long-term investor.

Looking at Australian DC schemes, Table 2 shows the same asset allocation breakdown:

Table 2: Australian defined contribution schemes, typical asset allocation

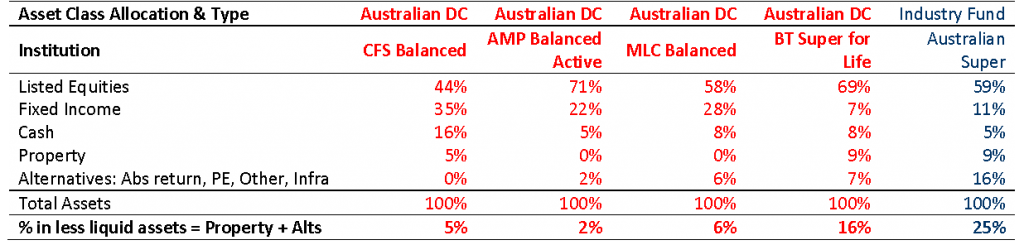
Source: Latest report and accounts of four public offer (retail) Australian DC Funds plus one large Industry Fund.

The first four red columns are public offer, retail super funds. The table shows how domestic DC schemes have a far greater focus on liquidity, with only 2%-16% in illiquid assets. Whilst average and up-to-date data is hard obtain, many SMSFs also look similar to these four funds. These two segments comprise nearly 60% of the assets in superannuation, making the impact of their decisions significant. And quite surprising given the long-term objective.

The final blue column in Table 2 is Australian Super, one of the large industry funds. Industry funds collectively represent approximately one fifth of superannuation balances. This fund’s asset allocation looks closer to the other long-term institutions. However the asset mix in less cashable investments remains heavily concentrated in just two areas: infrastructure and direct Australian property deals, rather than spread amongst a wide variety of asset types. This implies a less diverse approach to less liquid assets.

Why is DC in Australia so different?

If other global institutions armed with the best advice on how to meet their long-term objectives hold a high proportion of less liquid assets, why is DC in Australia so different?One theory is that the Australian investors confuse liquidity with safety. That is, they like to stay cashable because they are using liquidity as a proxy for risk.

Diagram 1 outlines a typical asset allocation using the scales of ‘risk and return’. The asset classes are well spread and appear well-diversified.

Diagram 1: Risk and return by asset class for DC funds

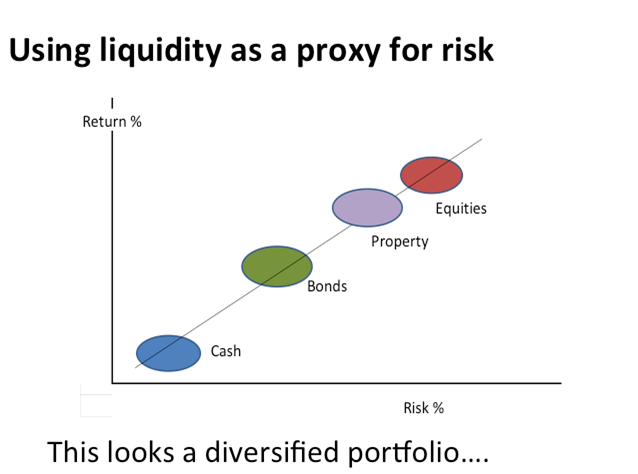
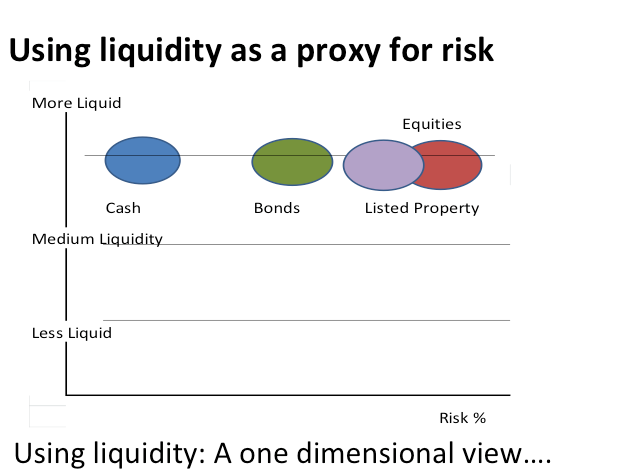
Diagram 2 outlines the same investments but with the vertical axis set as liquidity rather than return. The top horizontal line shows more liquid investments. Below are medium and less liquid investments (assets which cannot be easily sold). It highlights that the DC assets all fall into the more liquid category and so the portfolio is one-dimensional.

Diagram 2: Risk and liquidity by asset class for DC funds

Lost opportunities

The lack of diversification in DC portfolios creates a real disadvantage over other long-term investors because one-dimensional portfolios overlook many other interesting and opportunistic investment types.

Diagram 3: Risk and liquidity by asset class for other global investors

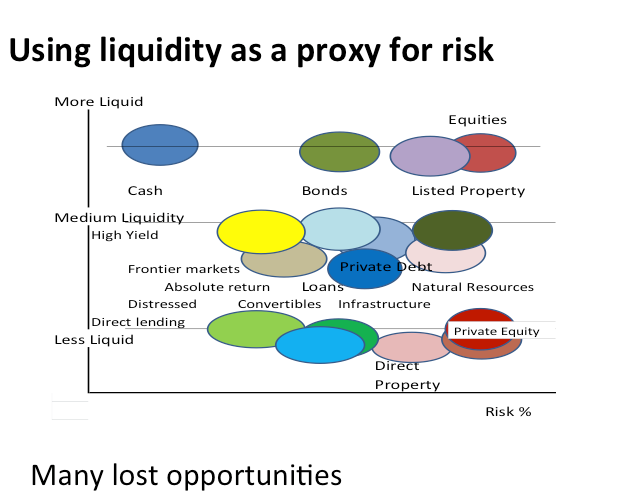
Diagram 3 highlights some of the less liquid opportunities that most DC investors miss. These include absolute return, emerging market credit, frontier markets, structured products, natural resources and infrastructure. These assets don’t all need to always be in a DC portfolio – far from it. In fact, with less cashable assets an opportunistic approach is preferable to pouring in monies simply because there is an allocation bucket to fill. One secret with less liquid assets is to generally invest in areas where others are not herding and look for the ‘less crowded’ trades.

Allocating a proportion of a portfolio into medium and less liquid investments provides three distinct advantages: a different return stream, a mixture of novel market returns which cannot be accessed passively; and a blend of different manager skills (including leverage, shorting, structuring using options and unique pricing models). Not having access to these less liquid investments disadvantages DC investors as they don’t have the opportunity to play to their strengths as long-term, patient and opportunistic investors.

Confusing liquidity with safety

If investors confuse liquidity with risk, it creates perverse outcomes. Consider the liquidity, pricing frequency and horizon of different asset classes.

Table 3: The characteristics of liquid and less liquid investments 

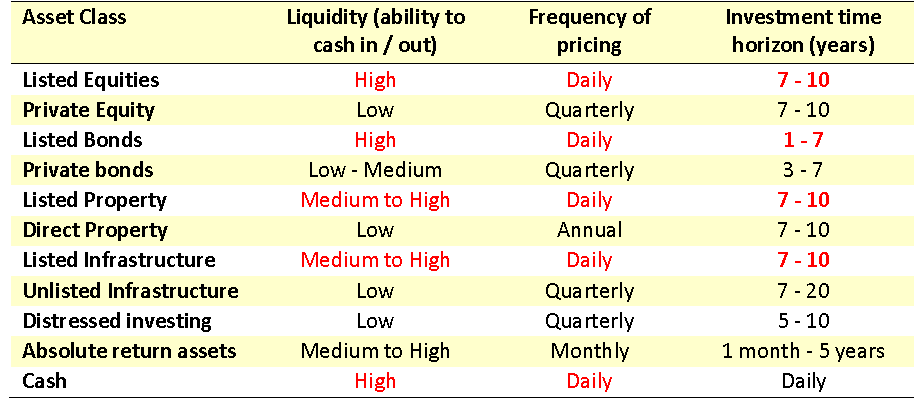
Across different types of investments, Table 3 assesses various characteristics: liquidity (high, medium or low), the typical frequency of pricing, and the recommended investment time horizon with red text identifying where frequency of pricing is daily. What is apparent is that in most cases the private market assets have a similar time horizon for investment purposes as the listed version. For example in private equity the recommended time horizon is seven to ten years for both private and public market assets. So an investor using skilled external funds should in theory be ambivalent about investing into either private equity (where the investments are not cashable) or in public equity (where they are cashable).

Focus on the investment time horizon

Believing that an equity security is safe simply because you can exit it on a daily basis belies the investment time horizon that should be incorporated for that type of investment (assuming the investor uses external funds rather than investing themselves). If we assume that DC superannuation investors are not traders nor specialists at market timing then the ability to get into and out of equities on a daily basis is an unnecessary characteristic, given the high-risk level of equity investment.

This highlights a major disconnect: equities are the riskiest asset class and yet because they are priced daily investors feel comfortable investing in them. The same applies broadly to property (direct and listed) as well as infrastructure investing – investors mistakenly confuse liquidity with safety. If a fund manager were to impose a minimum seven-year lock up on an equity fund, it is unlikely that they would attract many investors. Yet most investors should be looking at equities with a long-term, seven year or more investment horizon, not as a daily trading opportunity. Perverse indeed.

The Australian DC super fund obsession with liquidity can be detrimental to retirement outcomes as investors may miss out on many interesting medium and less liquid investments. In part 2, I examine other reasons for this obsession, and question whether DC member choice (as defined in Australian legislation) may be incompatible with long-term investing and leads to sub-optimal investor outcomes.


Bev Durston has over 25 years’ experience in implementing investment solutions for pension funds, sovereign wealth funds and fund managers. She now runs her own advisory business for institutional clients, Edgehaven Pty Ltd.


7 Comments
Mark
July 25, 2014

Thank you Bev for a good article. I look forward to part 2.

If memory serves me correctly, when NZ Super internalised investment strategy they took a novel approach. They started with the optimal mean-variance portfolio from CAPM; the market portfolio of ALL assets, both public and private. They then compared themselves with the average of all investors, and from understanding the differences they were able to determine an appropriate asset allocation for them; which due to their unusual situation meant a higher than average allocation to private market assets (ie illiquids).

Of course, Australian DC funds don't have the luxury of a single client that won't withdrawal monies for 10+ years. However, even with Australian DC funds, not all members will switch out from risky investment options into cash during market downturns. We've had that event and each superannuation fund now would be better informed of how their members might react during these periods.

Subject to each fund's membership, there is an argument for every Australian super fund to consider the improved diversification, reduced volatility and access to the liquidity premium that private market assets offer. Is that allocation 5%, 20%, or more? Only the fund and their asset consultant can answer that question. Is 0% appropriate? Perhaps and again that is up to the fund and their asset consultant, but perhaps not to the same extent that we observe in the Australian super system.

Bev Durston
July 25, 2014

Thanks Mark,
Interesting NZ perspective.
One of my concerns is that other long term investors utilize their advisers and yet end up with a different portfolio to most DC super fund portfolios.
The advisers are usually the same ones across institutions and so its not the case that there is a different source of advice for SWFs or endowments. Hence why is their advice different - for DB funds say - for solving the same problem of producing a sound retirement income? At the end of the day are we disadvantaging investors by solving the retirement solution in a very liquid way?
Its an empirical question. Even family offices - from $50m in assets upwards - on average maintain half of their asset base in less liquid form.
Part 2 looks at the impact of member choice, fees and a number of other reasons why we might elect to have a very liquid only portfolio.

Bev Durston
July 25, 2014

Thanks for your comments.

We are talking about a long term investing view here. The less liquid approach needs to be carefully constructed and implemented. A liquidity plan is obviously vital to managing less liquid assets. But as Superannuation investing is more of a marathon than a sprint there is a place, as other long term institutions demonstrate in having a variety of other investments alongside liquid ones.

In terms of returns, my investing track record has been that less liquid asset classes have performed equal to or better than equities with a lesser volatility over reasonable periods of time as long as an opportunistic approach is taken.
A major advantage is the downside protection that some of these strategies can provide, something that is not a feature of liquid markets where the broad market index accounts for such a high proportion of the returns. This comes either from the idiosyncratic nature of alternative assets with underwriting of downside risk a particular focus or from more formal hedging of downside positions in other strategies.

Part 2 will explore some of the other reasons for the liquidity focus in DC investing.

Jon B
July 25, 2014

I think you've overstated the benefits of adding investments with less liquidity. The lack of liquidity simply adds to the investors risk. I sought to verify your performance claims without success indeed I found the following dated Dec 2013.

"Harvard, Brown, Cornell, Stanford and Yale all under-performed a classic allocation of 60 percent stocks and 40 percent bonds and even benchmark returns for hundreds of other colleges and universities, according to a new ranking of five-year returns compiled by recruitment firm Charles A. Skorina & Co." CNBC

Bev Durston
July 25, 2014

Hi Jon B,
An interesting quote from CNN but one that does not tell the full story to me. I do not value "return only" league tables (any more than I do "fee only" tables) because they are too simplistic. They miss at what risk the return was earned. We know the tendency that what tends to be top one year can position towards the bottom in the following period.
Consistency and stability of risk adjusted return, sustainability of results over more than one economic cycle, downside risk mitigation across various market dislocations and a patient approach are to be appreciated in a long term investing strategy.
My part 2 article in a few weeks time will elaborate on some of the reasons for the liquidity focus in DC investing.

Graeme
July 25, 2014

There would need to be a reason for taking on investments with less liquidity, beyond simple diversification across the liquidity spectrum. Where do the 'less liquid opportunities', shown on Diagram 3, lie on the the risk/return graph (Diagram 1)?

Ramani
July 25, 2014

As someone who rushed to the super industry with my alert on liquidity (see the March 2008 paper on APRA website) ahead of GFC, when many funds froze payouts and sought APRA's approval to breach PDS provisions, I concede excess liquidity can affect long term returns. Easy to reiterate this truism when markets are up, contributions are back to normal and not enough people exit.

As Dumsfeldian unknowns and unknowables lurk around the asset management industry, this must be balanced with the inability to pay out when required. Otherwise APRA will have to exercise its Clayton's power (only approve, never can decline).

Stress testing; aligning to member age and industry profiles; impact of reputational impact on individual funds even if the markets are normal - with this, a well-calibrated liquidity policy can navigate the tensions between too much and too little.

Fund choice and portability, with publicised wrong-doing in the industry can suck liquidity in a jiffy. Not to ignore equity issues inherent in treating parts of a fund as virtual bankers to other parts. Why not set up an industry-wide liquidity management plan, as the major Banks have done years ago?

Do we need a crisis to trigger preemptive action?


Leave a Comment:

RELATED ARTICLES

Long-term investors fail to reap their natural advantage

Super prospects from Australia’s most powerful CIO

A tonic for turbulent times: my nine tips for investing

banner

Most viewed in recent weeks

2024/25 super thresholds – key changes and implications

The ATO has released all the superannuation rates and thresholds that will apply from 1 July 2024. Here's what’s changing and what’s not, and some key considerations and opportunities in the lead up to 30 June and beyond.

The greatest investor you’ve never heard of

Jim Simons has achieved breathtaking returns of 62% p.a. over 33 years, a track record like no other, yet he remains little known to the public. Here’s how he’s done it, and the lessons that can be applied to our own investing.

Five months on from cancer diagnosis

Life has radically shifted with my brain cancer, and I don’t know if it will ever be the same again. After decades of writing and a dozen years with Firstlinks, I still want to contribute, but exactly how and when I do that is unclear.

Is Australia ready for its population growth over the next decade?

Australia will have 3.7 million more people in a decade's time, though the growth won't be evenly distributed. Over 85s will see the fastest growth, while the number of younger people will barely rise. 

Welcome to Firstlinks Edition 552 with weekend update

Being rich is having a high-paying job and accumulating fancy houses and cars, while being wealthy is owning assets that provide passive income, as well as freedom and flexibility. Knowing the difference can reframe your life.

  • 21 March 2024

Why LICs may be close to bottoming

Investor disgust, consolidation, de-listings, price discounts, activist investors entering - it’s what typically happens at business cycle troughs, and it’s happening to LICs now. That may present a potential opportunity.

Latest Updates

Shares

20 US stocks to buy and hold forever

Recently, I compiled a list of ASX stocks that you could buy and hold forever. Here’s a follow-up list of US stocks that you could own indefinitely, including well-known names like Microsoft, as well as lesser-known gems.

The public servants demanding $3m super tax exemption

The $3 million super tax will capture retired, and soon to retire, public servants and politicians who are members of defined benefit superannuation schemes. Lobbying efforts for exemptions to the tax are intensifying.

Property

Baby Boomer housing needs

Baby boomers will account for a third of population growth between 2024 and 2029, making this generation the biggest age-related growth sector over this period. They will shape the housing market with their unique preferences.

SMSF strategies

Meg on SMSFs: When the first member of a couple dies

The surviving spouse has a lot to think about when a member of an SMSF dies. While it pays to understand the options quickly, often they’re best served by moving a little more slowly before making final decisions.

Shares

Small caps are compelling but not for the reasons you might think...

Your author prematurely advocated investing in small caps almost 12 months ago. Since then, the investment landscape has changed, and there are even more reasons to believe small caps are likely to outperform going forward.

Taxation

The mixed fortunes of tax reform in Australia, part 2

Since Federation, reforms to our tax system have proven difficult. Yet they're too important to leave in the too-hard basket, and here's a look at the key ingredients that make a tax reform exercise work, or not.

Investment strategies

8 ways that AI will impact how we invest

AI is affecting ever expanding fields of human activity, and the way we invest is no exception. Here's how investors, advisors and investment managers can better prepare to manage the opportunities and risks that come with AI.

Sponsors

Alliances

© 2024 Morningstar, Inc. All rights reserved.

Disclaimer
The data, research and opinions provided here are for information purposes; are not an offer to buy or sell a security; and are not warranted to be correct, complete or accurate. Morningstar, its affiliates, and third-party content providers are not responsible for any investment decisions, damages or losses resulting from, or related to, the data and analyses or their use. To the extent any content is general advice, it has been prepared for clients of Morningstar Australasia Pty Ltd (ABN: 95 090 665 544, AFSL: 240892), without reference to your financial objectives, situation or needs. For more information refer to our Financial Services Guide. You should consider the advice in light of these matters and if applicable, the relevant Product Disclosure Statement before making any decision to invest. Past performance does not necessarily indicate a financial product’s future performance. To obtain advice tailored to your situation, contact a professional financial adviser. Articles are current as at date of publication.
This website contains information and opinions provided by third parties. Inclusion of this information does not necessarily represent Morningstar’s positions, strategies or opinions and should not be considered an endorsement by Morningstar.